STEM I
Predicting Cov-SARS-2 Transmission Risk using Probabilistic Modeling
STEM is the most rigorous class at Mass Academy. We have a 5-month long project where we can conduct research or solve a problem through engineering. Doctor Crowthers does an amazing job guiding us trough our STEM projects. My project is about engineering a webapp to predict COVID-19 transmission risk.
Abstract
Currently, there are 26.2 million COVID-19 cases in the US due to people taking lower precautions to reduce transmission at public venues. This project aims to create a tool that provides individuals with information to make a responsible decision about visiting an establishment to prevent unnecessary SARS-CoV-2 cases. A probabilistic model that predicts the risk of an individual contracting COVID-19 (transmission risk) during a visit to an establishment was created. This model was integrated into a web app built using the StreamLit framework in Python3.8. It acquired data through parsing COVID-19 databases and obtaining venue-specific data through user-inputs. The transmission risk model worked by multiplying the likelihood an individual will encounter a virus carrier (exposure risk) and the risk the individual will contract the virus if one carrier is present (contract risk). The exposure risk model was tested through the Spearman’s Rank Correlation by calculating the correlation between the model’s risk prediction for 200 random counties to new cases two weeks later of the aforementioned counties. Contract risk was tested using four different scenarios. Transmission risk was tested using these four scenarios factoring three counties with ranging incidence rates. The exposure risk model averaged a Spearman Rank correlation of 0.81, placing it in the “very strong” category. The contract and transmission risk provided sensible predictions for the scenarios provided. This model can be easily expanded to other databases and adapted to high-incidence countries. Since virus-specific aspects can apply to other illnesses, the model can be adjusted easily for other viruses.
Phrase 1: In the United States, COVID-19 cases have risen to 26.2 million due to people taking lower precautions and following protocol to lower transmission.
Phrase 2: To prevent unnecessary COVID-19 cases, this project aims to provide users with a tool that gives them the information necessary to make a responsible decision to visit an establishment.
Summary of Background
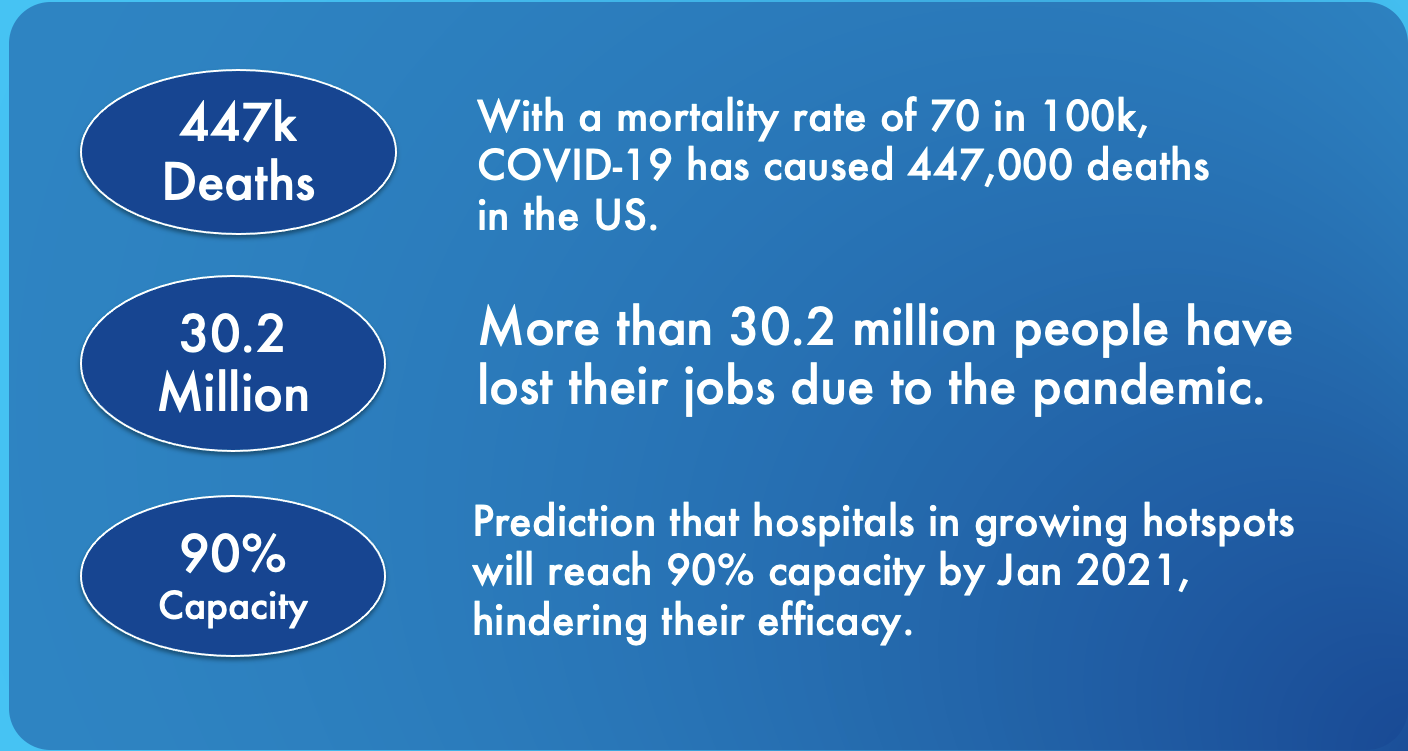
A pandemic is an international disease outbreak that affects millions of people over a vast geographic area. In modern society, extensive global travel and trade can exacerbate the effects of a pandemic. The severe acute respiratory syndrome coronavirus 2 (SARS-CoV-2), also known as coronavirus disease of 2019 (COVID-19), originated from a patient from Wuhan, China, in December of 2019. Cases in the United States began to skyrocket after a 4-month long quarantine. According to public health officials, the reopening of socially interactive venues, such as bars and theaters, and relaxation of social distancing protocol, allowing more people to attend a venue were significant factors for the spike seen (Gamio, 2020). The rise in cases leads to a multitude of detriments in the US. Most notably, the increase in cases has a clear connection to deaths, which is disheartening for the whole country and affects relatives/acquittances the worst. Growth in cases affects leads to a worse economy and ruins the livelihoods of millions. According to the Wall Street Journal (2020), due to COVID-19, 30.2 million people lost their jobs. Moreover, when cases arise, the healthcare infrastructure is poorly affected, impeding a hospital’s ability to serve their community effectively to treat the virus and other illnesses. Overall, the pandemic has disrupted the lives of many individuals medically, socially, and financially. Hence, people must be cautious and make informed decisions when deciding to visit an establishment.
Summary of Methods
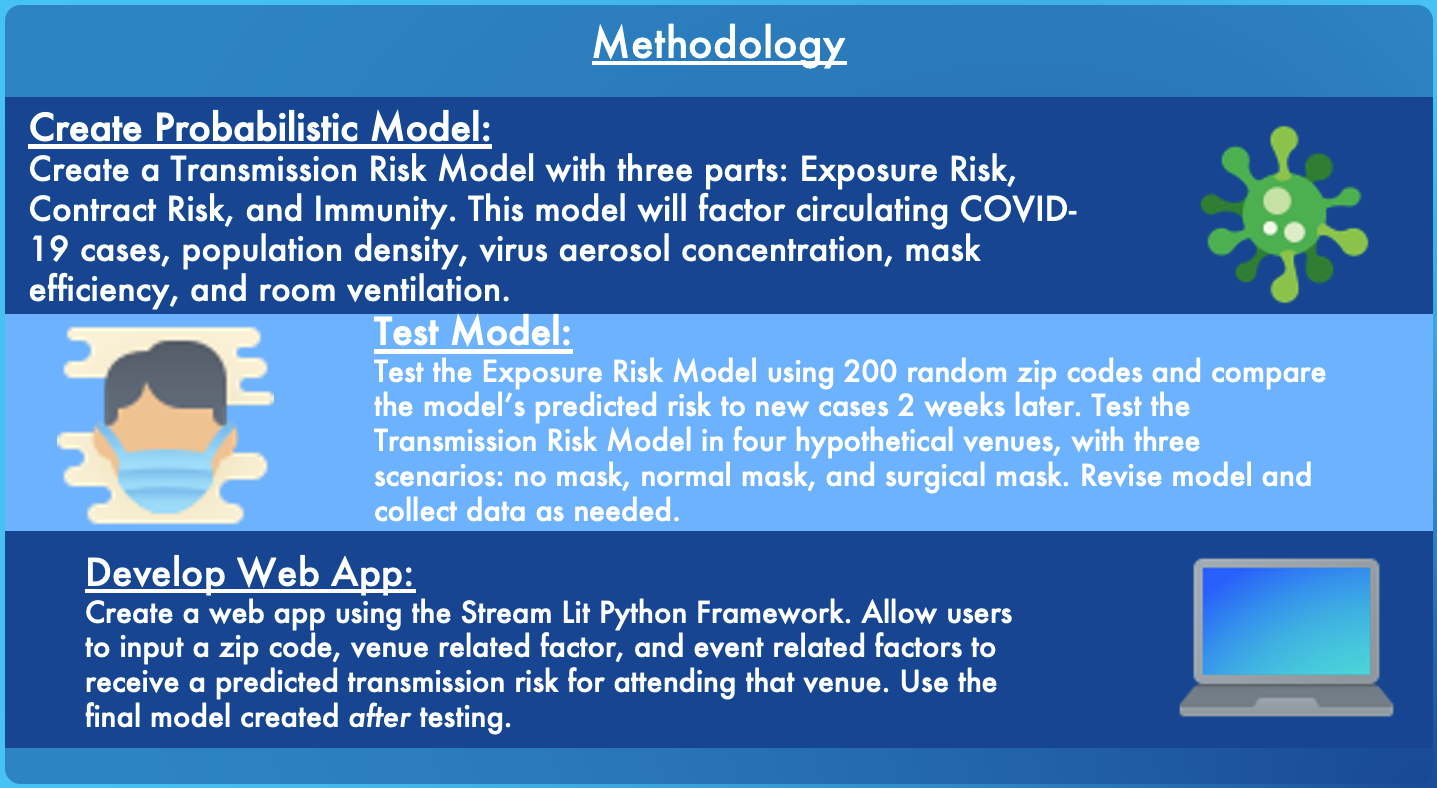
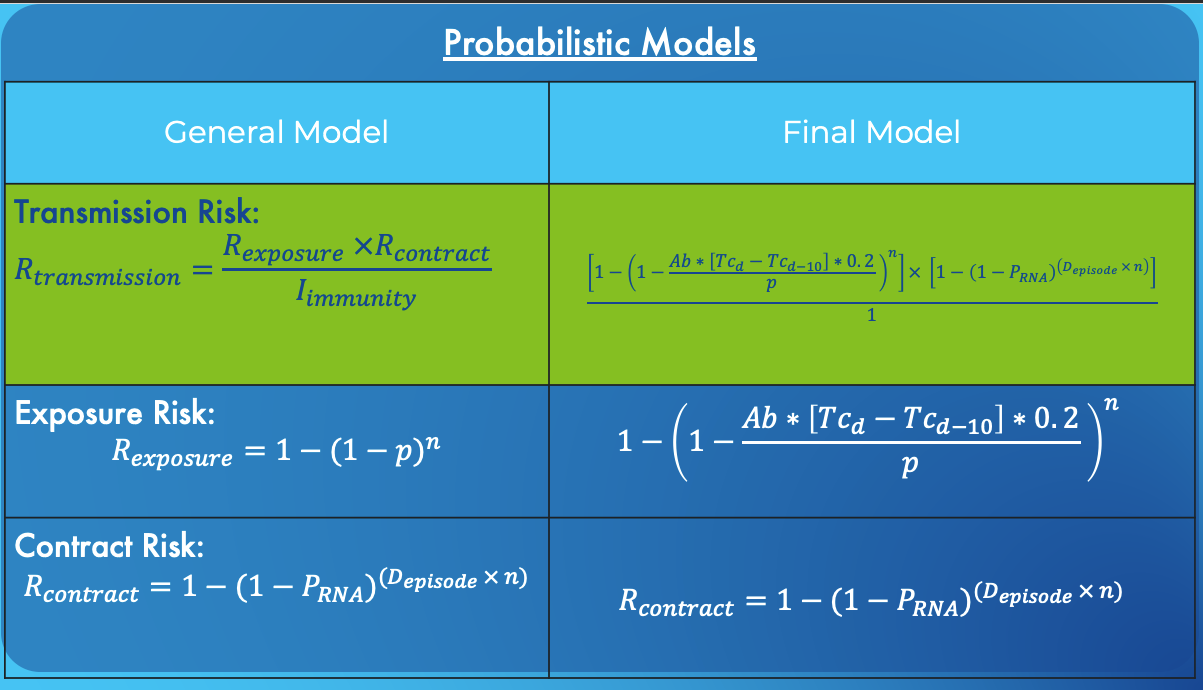
First, the transmission risk model predicts the likelihood that an individual will be infected with COVID-19 during their visit to the establishment. The model was created by creating three sub-models: exposure risk, contract risk, and immunity ability. Due to conflicting research, the immunity ability was assumed to be the same for all individuals and effectively disregarded in the transmission risk model. Exposure risk is the likelihood that one or more carriers of the virus are present in the venue during your visit. This was calculated by first finding the probability that a page cannot be at the venue during the visit and then subtracting it by one to the get probability for the opposite, which is exposure risk. Contract risk is the likelihood that an individual will contract the virus when they come in contact with a carrier. This is calculated by finding the probability of one dose of the virus not affecting infecting an individual and then raising it to the power of the total number of doses of the virus and individual would inhale during their visit to the environment times the total number of people in the environment. The total number of doses inhaled is calculated by factoring in mask efficiency, establishment volume, establishment ventilation, and the amount of speaking done at the establishment. The final transmission risk model is simply these two different models multiplied.
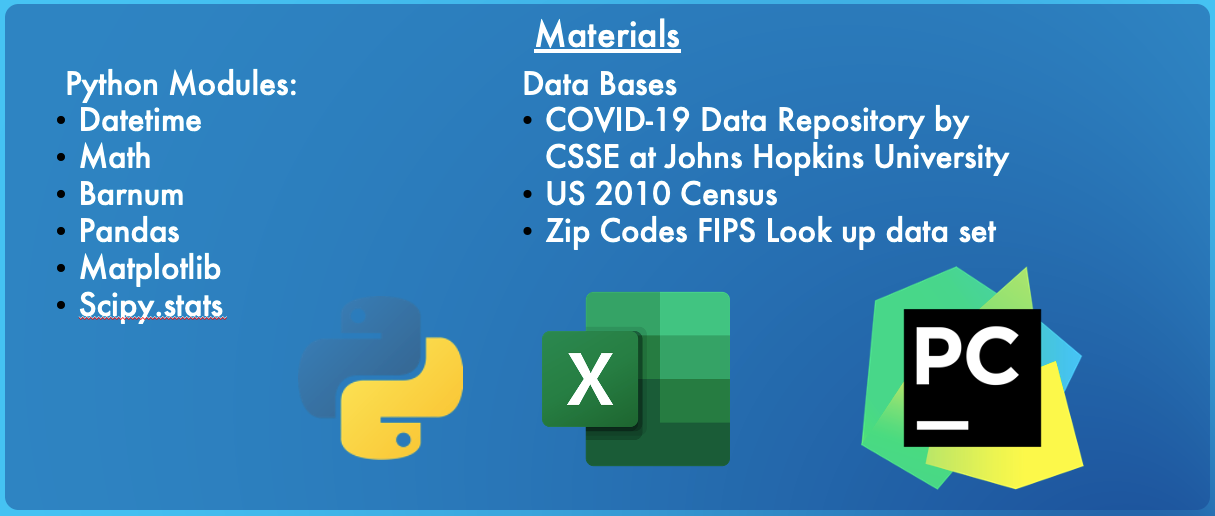
Then, these models were tested to assess their predictions. The two sub-models were tested individually and then tested combined as a transmission risk model. To test the exposure risk model, the Spearman’s Rank Correlation statistical test was used to see the correlation between the model’s exposure risk prediction and new case per 1000 people for 200 counties on 18 different dates (two scatter plots of these tests are shown, Figure 1 and Figure 2). That model would be shown to be more accurate the higher the Spearman ratio it gets. To test the contract risk model, I used four hypothetical venues to assess how reasonable the contract risk predictions were for these different venues. Lastly, the primary transmission risk model was tested by seeing how other counties with varying incidence and mask usage levels would vary the transmission risk. Again, the results were assessed by how reasonable the predictions were since there are no preexisting data sets with results to go off of. All model testing and creation were done in Python, and all data was stored on MS Excel.
The final step was to make these models available to users through a web app created using Python and the Stream Lit framework.
Her is a link to a prototype webapp built using streamlit and python.
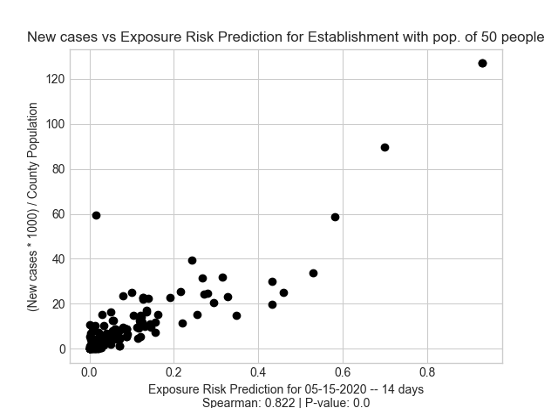
Figure 1: Exposure Risk for 05/01/2020 vs new cases from 5/01/2020 to 5/15/2020.
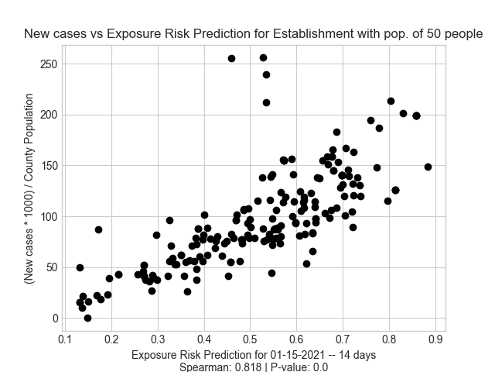
Figure 2: Exposure Risk for 01/01/2021 vs new cases from 01/01/2021 to 01/15/2021.
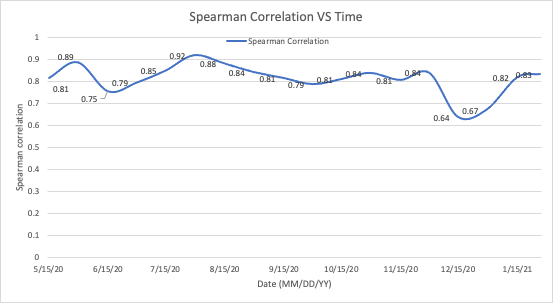
Figure 3: This chart visualizes the Exposure Risk Model’s accuracy for each month from 5/15/2020 to 1/15/2021.
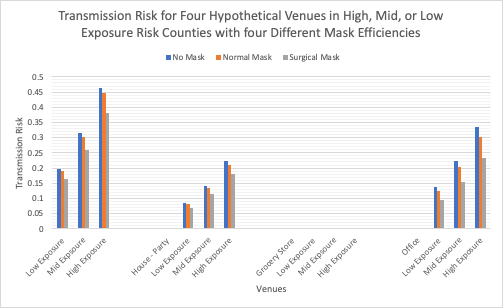
Figure 4: Transmission Risk for four venues - High School Classroom, House Party, Grocery Store, and Office - in high, mid, and low incidence counties and different mask situations.
Analysis
Exposure Risk
Firstly, the exposure risk model testing gave an average Spearman Rank Correlation of 0.81, which means that the model had a “very strong” positive correlation according to the statistical test. This shows that the Exposure Risk Model’s risk predictions are strongly correlated to the number of new case 2 weeks later. In addition, since the model was tested on a random set of 200 counties, it means these results would hold true for most of the United States. Because of the strong correlation, this model serves as an accurate model to use in the larger Transmission Risk Model.
After an analysis done between the dates and the Spearman Rank Correlation ratio it was found that the exposure risk model had a weaker correlation (about 0.2 lower ratio) for both dates in December (Figure 1). This can most likely be attributed to the unpredictable manner that new cases grew after period of vacation (Figure 6), where many individuals were in contact with outsiders. This suggests that the exposure risk model is not well suited to handle unexpected jumps in cases. Instead, as seen by the steady correlation between months seven to eleven, the model is more accurate during longer periods of fairly steady increase.
Some errors could have happened during the testing of the exposure risk model. Since this model was tested using random zip-codes generated through the Barnum Python module. One of the 200 counties may have been duplicates. Although this is extremely unlikely since there are 3006 counties in the US, it is still a possibility (source 2). This would impact how well the sample counties were analogous to all of the United States, which could provide biased results for a certain type of counties.
Finally, this model prove to be more accurate than other exposure risk models developed and tested using similar methods. A model created by Sun et all (2020), averaged a Spearman Correlation of 0.6, while this paper’s exposure risk modeled averaged a ratio of 0.81. Both were tested using the similar methods – by correlating exposure risk to new cases two weeks later. This paper’s model performed better because, when calculating circulating cases in a community, it found new cases between two weeks prior and the current date, while the other exposure risk model found circulating cases by summing new cases for ten days. In addition, my model’s circulating case estimate factored in unreported cases and asymptomatic cases through the Ascertainment Bias and multiplication by 0.2. These factors made my probabilistic model more realistic and allowed to provide a stronger exposure risk prediction.
Since the hypothesis was that the there would a positive correlation between new cases and the model’s exposure risk prediction, the hypothesis was confirmed by the average Spearman Rank Correlation of 0.81. The 18 tests conducted for the 18 different have a mean p-value of 1.57E-24, confirming that the data was significant.
Transmission Risk
The transmission risk model provided sensible results relative to the other hypothetical venues, mask scenarios, and county types. There were two hypotheses for this test. The first one was that the transmission risk prediction for each combination of mask efficiency and country exposure would go in this order for each venue: Surgical Mask + Low Exposure County < Surgical Mask + Mid Exposure County < Surgical Mask + High Exposure County < Normal Mask + Low Exposure County < Normal Mask + Mid Exposure County < Normal Mask + High Exposure County < No Mask + Low Exposure < No Mask + Mid Exposure < No Mask + High Exposure. This hypothesis was created based on the simple fact that High Exposure Risk counties present a high risk of coming in contact with a carrier and more efficient face masks provided better protection against transmission of the virus.
Based off of the results in Figure 8, the model’s results were exactly the same as the hypothesis. This means that the model’s transmission risk prediction make sense in context with the other venues; however, this test does show that the model’s probabilities are accurate. It only shows that that, relative to other venues, the probabilities (risk) make sense. To test if the actual risk prediction is accurate, on-site testing would need to be done in an actual community and real venue. Because of that, the transmission the risk prediction outputted by the model should be viewed as score between 1 and 100 instead of a probability. The score is helpful to compare different venues with each other.
The second hypothesis was that the average transmission risk prediction for each venue would be in this order: Grocery Store (Venue 3) < House Party (Venue 4) < High School (Venue 1) < Small Office (Venue 2). I hypothesized that the estimate would be lowest for the grocery store because of its lowest fraction of speaking (Table 3), its low event duration (Table 3), and most importantly its large volume compared to its population (Table 3). Since it has a low fraction of speaking and low event duration, an individual would have less instances and less time to inhale doses of the virus, leading to a lower transmission risk. Also, the larger volume of the venue violates he assumption of homogenous mixture of air, which is what Lelieveld et al. (2020) had assumed when creating the contract risk model used in my transmission risk model.
Conclusion
Overall, the model made the predictions similar to the hypothesis; however, the high school classroom (Venue #1) achieved the highest average transmission risk, instead of the hypothesized office (Figure 8). This is because the office actually had a larger volume and a lower amount of people inside the venue, so the result makes sense. In accordance with the hypothesis, this venue with the lowest score was the grocery store, mainly because of its lower population density and its large room size which violates the assumption made in the contract risk model of the homogenous mixture of air. This essentially means that the model cannot make accurate prediction for larger venues sizes; a potential solution to combat this would be to view the venue as smaller sections, such as rooms or hallways. It would be more accurate to get the transmission risk prediction for a specific room in a venue than the whole venue itself. For example, a school could be sectioned into different classrooms or a grocery store could be sectioned into different aisles.
Since the whole thesis is not posted on this web page, here is a link to my full STEM 1 thesis. (Note: As off February 7th, 2021, this version is a rough draft)
Poster (including zoomed-in sections)
References
Adda, J. (2016). Economic activity and the spread of viral diseases: Evidence from high frequency data. The Quarterly Journal of Economics, 131(2), 891–941.
Chande, A., Lee, S., Harris, M., Nguyen, Q., Beckett, S. J., Hilley, T., Andris, C., & Weitz, J. S. (2020). Real-time, interactive website for US-county-level COVID-19 event risk assessment. Nature Human Behaviour, 4(12), 1313–1319. https://doi.org/10.1038/s41562-020-01000-9
Freitas, I. (2020, April 3). Economic damage rises as coronavirus hit worsens – here’s what to watch. CNBC. https://www.cnbc.com/2020/04/03/us-economy-loses-701000-jobs-in-march-heres-what-to-watch-now.html.
Oh, S., Watts, W. (2020, October 26). Dow ends 650 points lower as rising COVID-19 cases, stalled stimulus efforts highlight recovery jitters. MarketWatch. Retrieved November 4, 2020, from https://www.marketwatch.com/story/dow-futures-fall-260-points-as-covid-19-cases-surge-stimulus-remains-stalled-11603712231
Rio, G. M. N. del, & Bogel-Burroughs, N. (2020, October 23). ‘At capacity’: Covid-19 patients push u. S. Hospitals to brink. The New York Times. https://www.nytimes.com/2020/10/23/us/covid-hospitalizations.html
Shumaker, L. (2020, November 5). U.S. sets new record for increase in COVID-19 cases day after election. Reuters. https://www.reuters.com/article/us-health-coronavirus-usa-idUSKBN27L07L
Sun, Z., Di, L., Sprigg, W., Tong, D., & Casal, M. (2020). Community venue exposure risk estimator for the COVID-19 pandemic. Health & Place, 66, 102450.